By Jake Velie, CPT, Founder, Chairman & CEO, National Integrative Health
The GLP-1 market has already changed. The real question now is not whether these therapies will keep growing. They will. The question is whether plan sponsors have a real strategy for managing them.¹ ²
Too much of the conversation is still framed the wrong way. It gets reduced to a yes or no coverage debate, cover it or exclude it, as if that alone settles the issue. It does not.² ³
Coverage alone is not a strategy. Exclusion alone is not a strategy either.
A plan sponsor can decide to cover GLP-1s and still lose control if there are no clear clinical criteria, no channel discipline, no oversight on duration of therapy, and no process for managing net cost. A plan can also choose to exclude them and still end up with pressure from members, employers, appeals, and market demand that does not go away.¹ ²
That is where the market is now. GLP-1s have moved past being a niche benefit question. They are reshaping employer conversations around pharmacy trend, specialty management, clinical governance, and fiduciary oversight.¹ ²
This split is already showing up in the market. PSG reported that nearly all plans now cover GLP-1s for diabetes, but only 40% offer them for obesity, and 49% of plans that do not cover obesity GLP-1s say they would not do so at any price. That tells you this is no longer a fringe benefits question. It is an active plan-design and cost-governance decision.³
That means the next step for plan sponsors has to be execution.
The first piece is clinical criteria. If a plan is going to cover these therapies, it needs a disciplined framework around who qualifies, under what conditions, with what documentation, and with what expectations for continued therapy. That includes diagnosis standards, prior therapy requirements where appropriate, prescribing oversight, and ongoing review. Without that structure, utilization expands faster than governance.² ³
The second piece is channel management.
Not every high-cost therapy should move through the same pathway without scrutiny. Plan sponsors need to know where a GLP-1 claim is being filled, what support programs may exist, what manufacturer assistance or patient advocacy pathways are available, and whether anyone is actively managing the lowest legitimate net-cost route. Too often, plans look at the claim only after the spend is already on the books.¹
That is reactive. It is not strategy.
We are also seeing what stronger GLP-1 discipline can look like in real plan modeling. In a de-identified jumbo-group analysis built on a U.S.-sourced formulary, NIH modeled a fixed all-in GLP-1 rate of $521 per utilizing member per month, 36% below the incumbent carrier’s standard estimate and 57% below its risk-managed estimate. That translated to projected annual savings of $11.5 million to $25.8 million, depending on member take-up.⁴ ⁵
Just as important, tighter guardrails did not raise the unit cost in that modeling. BMI thresholds, prior authorization, step therapy, and lifestyle-program requirements could be layered on without changing the price per fill. Under the incumbent’s rebate-based model, tighter eligibility raised the unit cost by 50%.⁴ ⁵
The third piece is net-cost discipline. This is where a lot of employers still stop too early. They may get more visibility into pricing, but visibility by itself does not solve the problem. Seeing spend is not the same as controlling spend. A report can tell you what happened. It cannot prove the plan used the best available pathway.¹ ²
That matters because GLP-1 demand is not slowing down. As more employers face pressure from utilization, workforce interest, and broader market normalization, the plans that do well will not be the ones with the loudest position. They will be the ones with the clearest process.¹ ³
That process should answer a few simple questions.
1. Who qualifies for therapy?
2. What clinical criteria must be met?
3. What channel should be used?
4. What cost-support options have been evaluated?
5. Who is accountable for the net result to the plan?
If a plan sponsor cannot answer those five questions clearly, it does not have a GLP-1 strategy yet.
This is also where employers need to be careful about confusing vendor activity with accountability. PBMs, TPAs, brokers, consultants, and clinical vendors may all play a role. But someone has to own the full picture. Someone has to be responsible for making sure access, clinical integrity, and financial stewardship are working together.
That is the gap I see in this market.
The conversation is finally catching up to the size of the issue. That is a good thing. But the next move cannot be more debate without operational discipline. Plans do not need another round of abstract opinions on GLP-1s. They need criteria. They need process. They need channel control. They need net-cost management.¹ ² ³
In short, they need a strategy.
Footnotes
1. Managed Healthcare Executive. “Growth of GLP-1 Therapies Has Reshaped the Market.” PBMI 2026, as summarized in AHIP Solutions SmartBrief, Sep. 15, 2026: GLP-1 therapies accounted for almost half of prescription drug sales growth, the diabetes market reached $98 billion, and weight loss treatments grew 75% year over year to $55 billion.
2. PLANSPONSOR. “Navigating the Current Landscape of GLP-1 Coverage.” Sep. 11, 2026. PLANSPONSOR NewsDash summary noting that attorneys from McDermott Will & Schulte reviewed the costs, benefits, and risks employers should evaluate when deciding how their benefits address GLP-1 medications.
3. PSG 2026 Trends in Drug Benefit Design Report webinar notes shared internally on Jun. 25, 2026: nearly all plans now cover GLP-1s for diabetes, 40% offer GLP-1s for obesity, and 49% of plans that do not cover obesity GLP-1s would not do so at any price.
4. National Integrative Health, de-identified GLP-1 coverage cost analysis for a jumbo labor health and welfare fund, Aug. 2026: modeled fixed all-in GLP-1 pricing at $521 per utilizing member per month, compared with incumbent estimates of $800 standard and $1,200 risk-managed.
5. National Integrative Health. GLP-1 Program Case Study, de-identified illustrative summary, 2026: projected annual savings of $11.5 million to $25.8 million depending on member take-up, with the same pricing holding under added utilization-management guardrails.
The Era of Passive Health Plan Oversight Is Ending
By Jake Velie, CPT, Founder, Chairman & CEO, National Integrative Health
Employers are getting squeezed from every direction on healthcare costs. That part is not new. What is changing is how they are starting to respond.¹ ²
For years, many plan sponsors treated high-cost healthcare as something to review after the fact. They got the renewal. They looked at the trend. They asked a few questions. Then they assumed the vendor stack had it covered.
That approach is breaking down.
U.S. healthcare costs have reached $5.7 trillion, more than $15,000 per person per year. At the same time, nearly 60% of surveyed employers told Marsh they plan to make benefits changes next year to help control costs.¹ ² That is not a minor adjustment. It is a signal that employers know the old model is not holding.
The conversation is also becoming more explicit about fiduciary duty. Plan sponsors are being pushed to understand and implement CAA provisions, meet fiduciary responsibilities, and build stronger processes aligned with ERISA requirements.³ This is not just a cost conversation anymore. It is a governance conversation.
That matters because the real problem is not only price. It is fragmentation.
The PBM may manage one piece. The TPA may manage another. The broker may see the problem but not operate the fix. The employer is left trying to connect the dots after the spend is already on the books.
That is why more employers are looking for partners who do more than administer benefits. They are looking for people who can help them act like fiduciaries.
High-cost claims make that need impossible to ignore. One outside analysis put it plainly: 80% of healthcare costs are driven by 20% of claimants, and 50% of healthcare costs are driven by 5% of claimants.⁴ When that much risk is concentrated in that few cases, passive oversight is not a strategy.
Pharmacy pressure only adds to it. Specialty medications now comprise nearly 80% of all new drug launches, and nearly half of those launches carry price tags above $150,000.⁵ Employers do not need more summaries telling them costs are rising. They need someone who can challenge the pathway before a bad default becomes a paid claim.
That is the shift happening now. Employers are asking harder questions. Where is spend concentrating? Which claims are being actively challenged? What alternatives were reviewed? Who owns the decision? How do we prove the plan bought well, not just processed correctly?
Those are fiduciary questions. And once employers start asking them, they usually realize generic oversight is not enough.
This is why specialized partners are getting more attention. Not because employers want another logo in the stack. They do not. They want control. They want accountability. They want a party that can step into the space between administration and outcome and actually manage the problem.
That does not require self-promotion to explain. It is simply where the market is headed. When costs rise, risk concentrates, and compliance expectations get tighter, employers move toward expertise that is operational, clinical, financial, and accountable at the same time.
The era of passive health plan oversight is ending.
And for employers who are serious about cost, that is a good thing.
Footnotes
1. Moving to Value Alliance, “Enough with the Blank Checks,” Sep. 15, 2026. Summary states that U.S. healthcare costs have reached $5.7 trillion, more than $15,000 per person per year, and frames a 12 to 24 month roadmap from passive payer to active fiduciary. Link shared by user: https://www.movingtovalue.org/enough-with-the-blank-checks?utm_campaign=7ebc36f3-b142-46b4-acf7-6228b99dc19c&utm_source=so&utm_medium=mail&cid=322adc3d-c936-40c5-815b-713c3ca416dd
2. PLANSPONSOR NewsDash, “Employers Gear Up for Biggest Healthcare Cost Spike in 20 Years,” Sep. 8, 2026. Summary notes that nearly 60% of surveyed employers told Marsh they planned to make benefits changes next year to help control costs.
3. PLANSPONSOR, “Your Health Benefit Fiduciary Roadmap Starts Here!,” Mar. 25, 2026. Invitation copy states the series would help plan sponsors and advisers understand and implement CAA provisions, confidently meet fiduciary responsibilities, and build robust processes aligned with ERISA requirements.
4. AHealthcareZ, Eric Bricker, MD, “#1 Cause of High Healthcare Costs is…,” Oct. 28, 2025. Summary states that 80% of healthcare costs are driven by 20% of claimants and 50% of healthcare costs are driven by 5% of claimants.
5. RxBenefits Team, “Take Control of Specialty Drug Costs,” Aug. 24, 2026. Summary states that specialty medications comprise nearly 80% of all new drug launches and nearly half of them carry price tags exceeding $150,000.
Why Brokers Are Asking for Infusion Carve-Outs Now?
By Jake Velie, Chairman & CEO, National Integrative Health
When brokers start raising infusion carve-outs in renewal conversations, it is a sign that the old approach to medical-benefit drug spend is under pressure.
This is not a labeling exercise. It is about cost, accountability, and control.
In one recent NIH case, a broker managing over 70 self-funded groups asked whether an infusion carve-out could be put in place for a 10/1 renewal after reviewing claims that included Keytruda and other J and Q codes.¹ (Source note: Internal NIH case notes.) In another July case, a broker requested a deeper repricing analysis focused on site-of-care adjustments and Cyramza.² (Source note: NIH case notes on site-of-care repricing.) Those cases matter, not because two anecdotes prove a trend, but because they reflect where sophisticated intermediaries are starting to focus.
They are looking harder at provider-administered drugs billed through the medical benefit. They are asking what the plan actually paid. They are questioning whether the hospital outpatient department was the right setting. And they are recognizing that a standard renewal conversation does not answer those questions well enough.
An infusion carve-out is not a solution by itself, and it is not automatically the right answer.
At a practical level, it usually means separating some portion of infused and injected drug management from the default medical-claim workflow so the plan can evaluate a different mix of site of care, sourcing, prior authorization, clinical review, and network strategy. The point is not the carve-out itself. The point is to stop treating every infused claim as if its current pathway must be accepted.
That distinction matters.
Too many employers still approach infusions as though the only variable is the drug. In reality, the economics are shaped by at least four moving parts: the therapy selected, the place of service, the reimbursement structure, and the discipline of the people managing the claim. When those four variables go unmanaged, high-cost cases consistently flow to the most expensive channel.
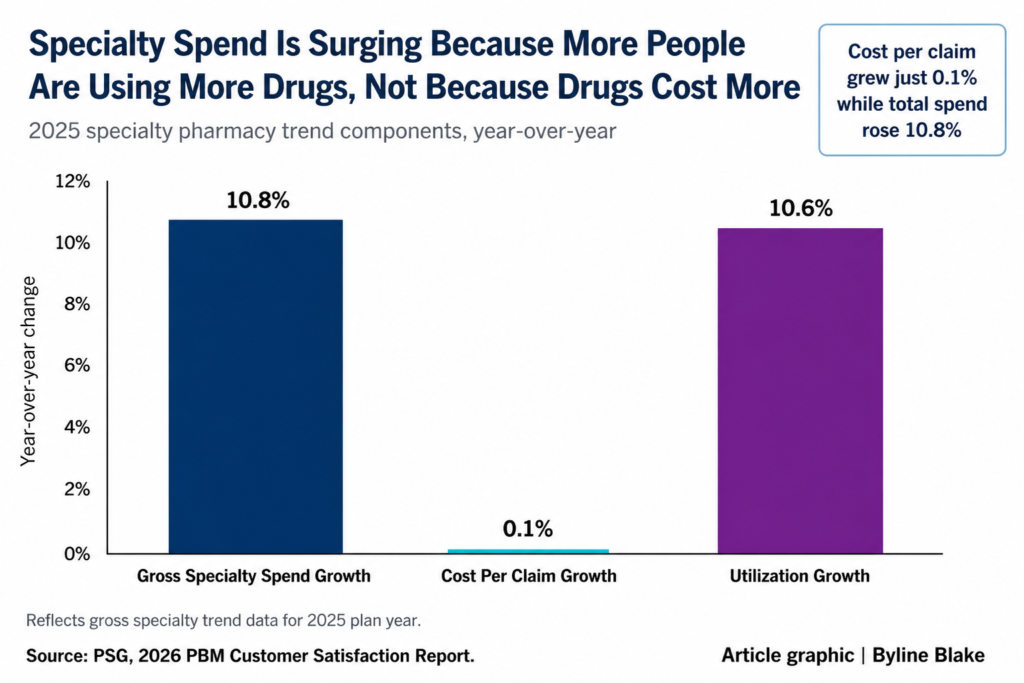
The broader specialty market is already telling employers that high-cost drug management cannot be treated as a rebate exercise. In PSG’s latest specialty trend discussion, gross specialty spend grew 10.8 percent in 2025 while cost per claim was nearly flat at 0.1 percent. Utilization grew 10.6 percent.³ (Source note: PSG specialty trend findings.) More members are using more high-cost therapies, across more conditions, for longer periods of time.
Figure 1: Specialty Spend Is Surging Because More People Are Using More Drugs, Not Because Drugs Cost More
That utilization dynamic is especially important in the infusion setting.
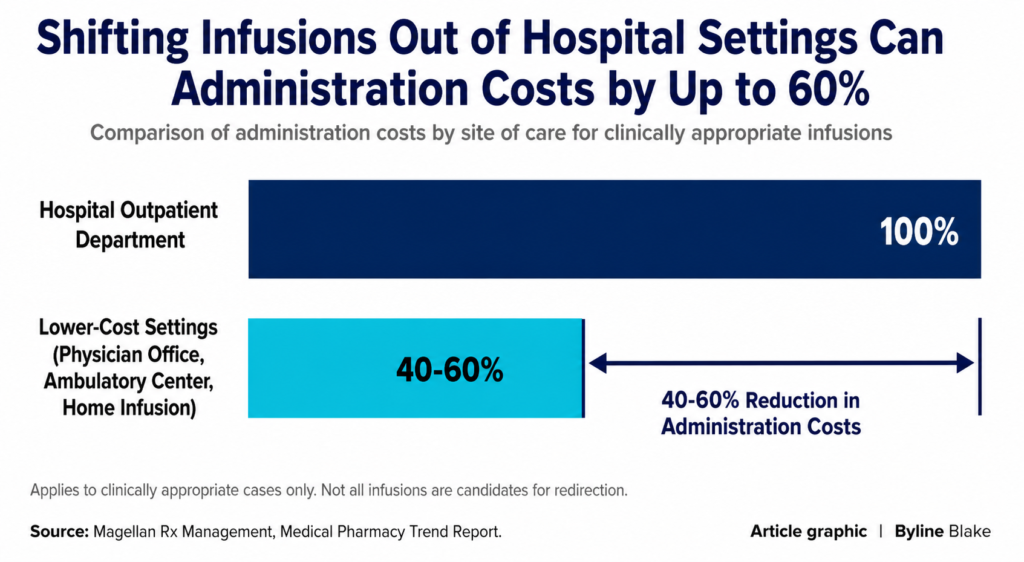
Once more high-cost therapies move through the medical benefit, the site of care starts to matter significantly. Magellan Rx Management has cited research showing that shifting infusions from hospital outpatient departments to clinically appropriate lower-cost settings such as physician offices, ambulatory infusion centers, or home infusion can reduce administration costs by 40 to 60 percent.⁴ (Source note: Magellan site-of-care optimization research.) That does not mean every infusion belongs outside the hospital. It does mean every routine case deserves scrutiny.
Figure 2: Shifting Infusions Out of Hospital Settings Can Cut Administration Costs by Up to 60%
That is why brokers are asking harder questions. They are seeing the same thing employers are seeing in their claims experience: infused drug spend is not something you can review once a year and set aside.
The problem is not just price. It is process.
The structural problem for many plans is that they do not have a clean answer to a simple question: who is responsible for proving that a high-cost infused claim was routed through the lowest reasonable net-cost path?
The PBM may not own it if the drug is billed through the medical benefit. The TPA may process the claim correctly without knowing to challenge the site. The broker may spot the problem without being aware how to operate the fix. The hospital has no reason to volunteer a lower-cost setting if the current one pays well.
That leaves the plan sponsor holding the financial risk and, increasingly, the governance burden. As the U.S. Department of Labor and Employee Benefits Security Administration continue to press for greater health-plan transparency and accountability, employers should assume they need a clearer record of how high-cost pharmacy-related claims are being evaluated and managed.⁵ (Source note: DOL and EBSA guidance on oversight and accountability.)
This is why infusion carve-out conversations keep reaching the renewal table. They are often less about replacing a vendor and more about creating a process that does not depend on passive default behavior.
The industry tends to turn real operating problems into marketing categories.
The important issue is not whether an employer adopts a vendor’s preferred label. The important issue is whether the employer can demonstrate that it understands where infused drug spend is landing, why it is landing there, and what alternatives were considered.
If a carve-out helps create that discipline, it is worth considering. If the same discipline can be achieved through other means, that is equally valid. But inaction is no longer a defensible position.
When high-cost infused claims continue to flow into expensive settings without a documented challenge process, the plan is not managing the trend. It is absorbing it.
Do not wait until the next renewal to get clarity on infused drug spend.
Pull the high-cost claims. Identify the sites of care. Reconcile the true net paid amounts. Review which therapies could have been managed differently. Make sure someone can explain, in writing, why the current pathway was used on the largest cases.
Infusion carve-outs are getting attention because employers are finally confronting a simple reality: hospital-based drug administration is not just a clinical event. It is a purchasing decision, a network decision, and a governance decision.
The plans that take that seriously will be in a much better position than those still treating infused drug spend as an unavoidable cost of doing business.
Jake Velie is Chairman & CEO of National Integrative Health, a managed services organization headquartered in West Des Moines, Iowa, focused on prescription drug cost optimization for self-funded employer health plans.
Internal NIH case notes describe a broker with 70 groups seeking an infusion carve-out for a 10/1 renewing group after review of claims including Keytruda and other J/Q codes.12
NIH case notes describe a broker request for deeper analysis of site-of-care adjustments and Cyramza repricing.
PSG, 2026 Pharmacy Benefit Manager Customer Satisfaction Report. Internal notes summarizing 2025 specialty trend findings: gross specialty spend grew 10.8%, cost per claim was nearly flat at 0.1%, and utilization grew 10.6%.
Magellan Rx Management, Medical Pharmacy Trend Report: Site of Care Optimization. Shifting clinically appropriate infusions from hospital outpatient departments to lower-cost settings can reduce administration costs by 40 to 60 percent.
U.S. Department of Labor, Employee Benefits Security Administration. Used here to support the employer-accountability and documentation framework for pharmacy-related spend oversight.
PBM PUGILISM – With the Big Three Pharmacy Benefit Managers Facing greater scrutiny, more independent players are jockeying for position
David vs. Goliath battle continues to intensify across the pharmacy benefit management landscape as self-insured employers struggle with reining in their Rx spend.
In one corner lie the so-called Big Three PBMs, which are vertically integrated with the nation’s largest health insurance companies and control about 80% of U.S. prescription drug claims. They include Express Scripts, which is owned by Cigna, CVS Caremark, which owns Aetna, and OptumRx, which is owned by the same parent company as UnitedHealthcare.
At the other end of the ring are nearly 100 independent PBMs scrambling for the remaining slice of market share. Many claim their model is “transparent,” while a handful go out on a limb to describe their offering as “fiduciary.” But industry experts say semantics can be misleading.
Self-insured group health plans appear to be giving the proverbial Davids of this industry a closer look. Consider, for example, that as many as 92% of 300 benefits decision-makers surveyed by the Penta Group for Evernorth believe a model that passes savings directly to members would improve transparency. Moreover, 90% said a PBM model without rebates would make it easier for employees to afford their medications and improve benefits satisfaction.
Higher Expectations
Jeff Malone
Whereas transparency was a differentiator nearly a decade ago in the PBM space, it’s now a minimum expectation, opines Jeff Malone, Co-Founder, President, and CEO of RxPreferred. He says the conversation has shifted to whether transparency is complete, auditable, and aligned, while the future will be backed by aligned incentives and real-time data.
“Independent PBMs are gaining traction, especially among employers and health systems seeking greater flexibility and alignment,” Malone observes, noting how employers are now looking beyond size and perceived discounts. “They’re asking tougher questions about pricing, rebates, data ownership and conflicts created by vertical integration.”
A mass migration among small and midsize businesses from fully insured health plans to level-funding and self-funding has changed the rules of engagement with PBMs in recent years. “We’re seeing a big shift of market share increasing into that transparent PBM tranche in the market simply because of affordability,” says Jake Velie, Chairman and CEO of National Integrative Health.
Another huge driver is the federal government ramping up regulatory scrutiny of PBM practices, with Acting Labor Secretary Keith Sonderling making the drafting of new PBM transparency regulations a top priority.
Several states have also tried to block PBM ownership of pharmacies, concerned about conflicts of interest that may arise with such enormous scale. Arkansas is the only state that has enacted a law to do just that (in 2025), while proposals are pending in Tennessee and Arizona and under consideration in Indiana and Connecticut. Iowa also is considering aggressive PBM reforms.
A Curtain Of Complexity
Renzo Luzzatti
It’s easy to see why this is happening. The fact is that PBMs have operated behind a curtain of complexity for far too long, earning billions each year from spread pricing, rebate retention and opaque formulary steering in contracts with health plan sponsors, Velie argues.
US-Rx Care President Renzo Luzzatti doesn’t see much clinical diligence or rigor across the transparent PBM industry in part because many of those owners haven’t ever done a prior authorization. “You got folks that were tired of pharmacy margins, and so they started a PBM,” he opines.
In light of these headwinds, his firm fields peer-to-peer calls with doctors on a regular basis, noting that the quickest way to resolve a disagreement is to simply pick up the phone and have a conversation with a clinician. In one case, he recalls how a doctor eventually admitted to prescribing a 40% higher growth hormone dosage for a patient that needed to be corrected. It saved the plan $33,000. “This stuff happens every day,” he reports.
A pioneer in the independent PBM space, Luzzatti is aware of only a handful of organizations in the marketplace that – like his firm and Velie’s – actually describe themselves as a “fiduciary” PBM or pharmacy program. To do that, it means pledging that there will be no conflict of interest, such as accepting rebate money; they will look out solely for the best interest of the plan and its participants; and all utilization and financial information is in full view.
“We cite the ERISA regs, and it means that we’re held to the same legal standard as our self-insured employer clients are as fiduciaries of their own plan,” he says.
That contrasts with common language in PBM contracts that explicitly state that they’re not a fiduciary and not obligated to act in a fiduciary manner, he adds. Some will even allow for contracts to be canceled if a state requires PBMs to be a fiduciary.
In addition, he says there are PBMs that call themselves transparent while also claiming they’re not obligated to act in a fiduciary manner. Most times, the inference is that they charge an admin fee and don’t do spread pricing. In that regard, Luzzatti explains that the word transparency is nebulous. “It’s not a legal term. You can’t take them to court over that. It’s whatever they say it is,” he says.
A PBM may position certain formulary drugs in tier one and tier two to access greater rebates from the manufacturer, and hence usually pocket them, Velie observes. “You’re keeping certain brand drugs in a preferred tier when you should be putting a biologic there,” he says.
The only industry players that actually meet the definition of a fiduciary PBM are those that are willing to do the reporting necessary for the fiduciary filing for the plan sponsor and hand them over to comply with their duties under the Affordable Care Act and Consolidated Appropriations Act of 2021, Velie notes.
An Ability To Access Data
Jake Velie
True price transparency lies in how PBMs get paid. “If we look at the PBMs that we like to work with, there’s no funny business in the contracts,” he explains. “They’re not trying to hide behind intellectual property contingencies in the contract. They’re showing you what the pricing is. Their fees are flat.”
His company works with some PBMs that charge a per-script fee, while others charge an admin fee.
Neither of those natural-flow models is easy to manipulate. He says there’s very little that a PBM can hide if the data is available. National Integrative Health deploys a multi-lever approach to achieve the lowest net cost on every claim for every member. It includes 340B pricing, biosimilars, 503B manufacturer direct contracting, variable copay programs, clinical interventions and clinical trial program access.
Many of the transparent and fiduciary PBMs are operating on Big Three chassis that they’re white labeling, Velie says. What’s different is their business and contract practice, as well as a commitment to data transparency for the end client. Their relatively slow adoption can be traced to the snail’s pace of imposing regulatory changes on the healthcare industry when lobbyists still hold considerable sway over lawmakers, he adds.
While jumbo employers can afford to stay with the Big Three, he notes that they’ve already been forcing them to improve practices because they have the leverage to do just that. Significant change is already afoot. For example, CVS Caremark recently agreed to allow clients to opt out of standard rebate-based payment designs and pass discounts directly through to consumers as part of a settlement with the Federal Trade Commission. Despite that move and any others that might follow, Velie believes the Big Three will still give careful thought to how they’re going to recover that lost revenue in other areas.
Underwriting Decrements
Scott Byrne
From a high-level strategic standpoint, the PBM serves as a linchpin to get underwriting consideration for plan design and execution on high-cost drugs, according to Velie.
“We are constantly working with stop-loss carriers in underwriting and actuarial practices because we can predict our outcomes when we have the right plan design,” he reports. “So, when we give them our analysis during the underwriting process, it is guaranteed to work, and we are seeing normally up to 10% reductions in stop-loss renewals because we have the right formula and we cannot execute on the right formula without the right PBM partner.”
Blackwell Captive Solutions President Scott Byrne notes that as recently as three to five years ago, “most stop-loss carriers were not offering decrements for PBMs. It just wasn’t being factored into their manual rate whatsoever. They would factor in network and TPA, but PBMs surprisingly were left out of the mix.”
Since that time, he says prescription drug costs swelled from roughly 20% to 25% of an employer’s annual health plan spend to more than 50%. Therefore, he believes this bigger piece of the pie deserves to be addressed and accounted for in a health plan’s pricing.
Given all that’s at stake, pharmacy benefits are becoming a year-round risk management function instead of an annual renewal discussion, according to Malone. He says claim-level visibility allows employers to identify high-cost trends early, manage specialty drugs and GLP-1s proactively and coordinate pharmacy strategy with the broader health plan.
One health system client of his was able to reduce pharmacy costs by 38% through a combination of transparent PBM administration, active utilization management and customized pharmacy strategies that leveraged its own pharmacy resources.
Eyeing Efficacy
Katherine Shanahan
While the cost of prescription drugs is top of mind, so is the impact on clinical outcomes. Pressure is mounting on self-insured employers to determine whether drugs on their formulary are actually benefiting health plan members relative to other scripts in the face of rising medical and pharmacy costs, observes Katherine Shanahan, Director of Pharmacy Consulting for Merative. To put it another way, is there a meaningful enough return on investment?
The use of GLP-1s for weight loss has spotlighted this concern. She says there’s such a high rebate percentage for these drugs that without price transparency, it’s difficult to determine whether there are downstream health improvements and savings from patients no longer experiencing flare-ups.
While huge biometric improvements have been seen with GLP-1s, she notes that there’s still a lot of exploration with regard to stepping down a patient over time and realizing that longevity requires a different cost model.
A Restless Market
While some health plan participants are more comfortable having a household name on their ID card, Byrne believes smaller independent PBMs are achieving the most progress relative to the Big Three when it comes to transparency.
He uses a construction analogy to describe the captive-PBM relationship, noting that the captive serves as the general contractor that builds a meaningful risk-management strategy and hires a PBM as one of several subcontractors. Choosing the right PBM is critical. “We want to bring best-in-class point solutions to our members because ultimately we need to be good stewards of their money,” he says.
As many as 30% of the employer population is out to bid now on a PBM in the course of a typical year, Luzzatti reports, noting that frustration is mounting upstream to jumbo employers and predicting that most self-insured clients will have made a change in three years.
“Their concern from a legal standpoint is that they might be the next target like Johnson & Johnson, Wells Fargo and JPMorgan Chase. Nobody wants that,” he says.
Velie predicts that there will be a meaningful shift in the market away from the Big Three given these high-profile lawsuits alleging that employers are overcharging for prescription drugs, and as a result, breaching their fiduciary responsibility under ERISA to act in the best interest of plan participants.
“I think they can only survive so much bad publicity,” he says of the Big Three, “and now that these fiduciary and transparent PBMs are getting up to the point where they’re scalable, they can handle larger populations and serve their clients well. I think over the next five years, that segment of the PBM market will see more growth than they’ve seen in the last 15.”
Historically, Shanahan points to constraints in the request-for-proposal process that have eliminated smaller or boutique PBMs from contention. However, she sees more midsize health plans having them at least fill out the remainder of the RFP and change some of the metrics they’re looking at even though they didn’t rank highest.
Adds Malone: “Transparency tells an employer what happened. Alignment determines why it happened and whether the PBM had an incentive to deliver the best result.”
Bruce Shutan is a Portland, Oregon-based freelance writer who has closely covered the employee benefits industry for nearly 40 years.
From The Self-Insurer, September 2026 Edition
The 2027 Cost Challenge Employers Can Act On: Site of Care, Stop-Loss, and Specialty Drug Sourcing
By Jake Velie, Chairman & CEO, National Integrative Health
The 2027 Segal Health Plan Cost Trend Survey should change the conversation for every self-funded employer. The issue is not simply whether costs will rise. It is whether the same high-cost claim will become more expensive because of its site of care, its sourcing pathway, and its lack of active management, then show up again in the plan’s stop-loss economics.
Segal projects 2027 medical trend for open-access PPO/POS plans at 9.9 percent. Outpatient prescription drug trend is projected at 11.5 percent before PBM rebates. Specialty drugs and biologics are projected at 11.9 percent. Those are near double-digit projections and the highest medical projections Segal has reported in nearly 15 years.
Insurance Business Magazine’s August coverage places the same pressure in the context of employer health costs and billing practices. That is useful context, but it is not an action plan. Employers need to know where the pressure is entering the claim and what they can do before the cost becomes a renewal problem.
Figure 1. 2027 trend snapshot
The place of service is part of the claim
Segal’s SHAPE data warehouse, which tracks actual claims experience for a sample of large self-funded plan sponsors, found that medical trend reached 8.9 percent in 2025, up from 8.0 percent in 2024. Outpatient hospital expenses led the major service categories at 10.4 percent, compared with 5.8 percent for inpatient care and 8.2 percent for professional services.
That matters because many specialty biologics and infused therapies are administered through the medical benefit, often in outpatient hospital settings. Segal defines specialty drugs as generally high-cost therapies for rare conditions or drugs that require special handling, including products given by injection or infusion.
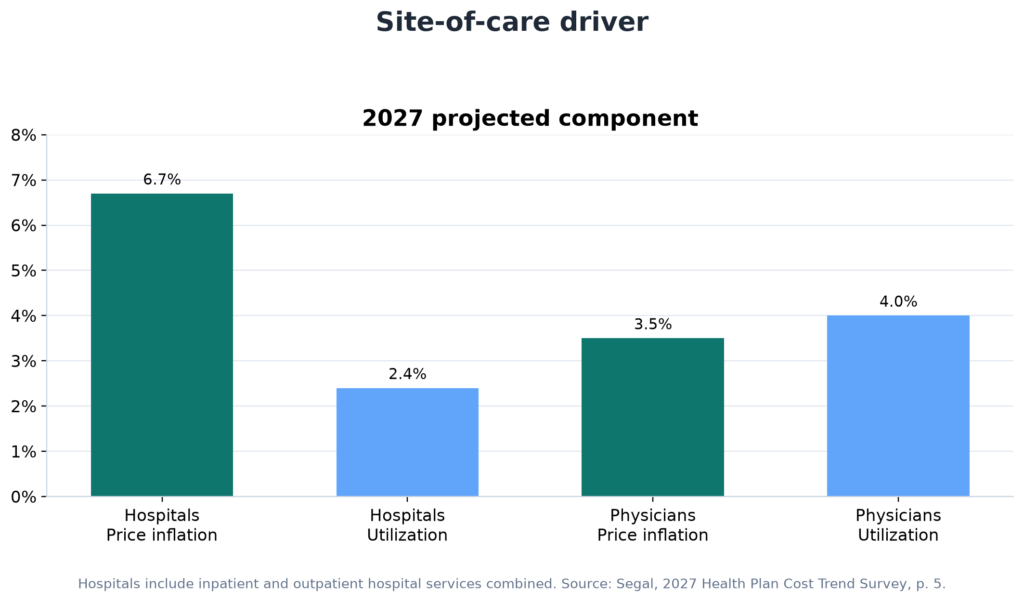
The clinical need may be the same, but the total cost can change materially based on where the therapy is administered, how the provider is reimbursed, and which sourcing channel is used. Segal reports hospital price inflation at 6.7 percent, compared with 2.4 percent hospital utilization. For physicians, the components are 3.5 percent price inflation and 4.0 percent utilization. The report defines hospitals here as inpatient and outpatient hospital services combined.
The point is not that every infusion belongs outside a hospital. The point is that every high-cost case deserves review. A clinically appropriate shift to an ambulatory infusion center, physician office, or home setting can materially change the cost of administration. Magellan Rx Management has cited research indicating that moving clinically appropriate infusions to lower-cost settings can reduce administration costs by 40 percent to 60 percent.
Figure 2. Site-of-care driver
Prescription drug trend is a mix and utilization problem
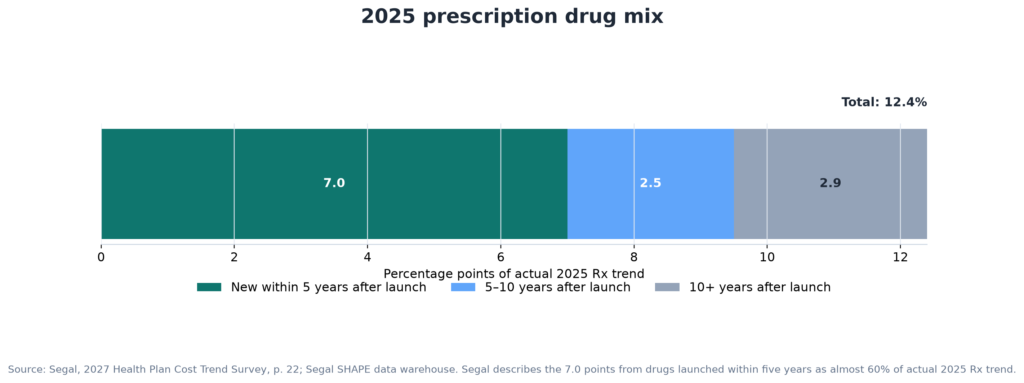
The 11.5 percent outpatient prescription drug projection should not be read as simple price inflation on existing products. Segal’s data points to a changing mix of therapies. Actual prescription drug trend increased from 10.4 percent in 2024 to 12.4 percent in 2025. New-to-market drugs launched within the previous five years accounted for 7.0 percentage points of that 12.4 percent, or almost 60 percent of actual 2025 trend.
That innovation is concentrated in oncology, immunology, rare disease, and cell and gene therapy, where costs are high and use is expanding. The practical question for employers is not whether innovation is valuable. It is whether the plan has a deliberate way to manage the mix, the channel, and the net cost as new therapies enter the benefit.
Figure 5. 2025 prescription drug mix
GLP-1s add another layer. Plans covering GLP-1s for obesity management experienced an 18.3 percent prescription drug trend in 2025, compared with 10.5 percent for plans that did not cover anti-obesity medications. Segal attributes 7.8 percentage points of the covered-plan trend to GLP-1s. This does not argue against coverage. It argues against treating coverage as the entire strategy. Employers need evidence-based criteria, clinical management, benefit design, and a clear access pathway for members and providers.
Figure 4. GLP-1 coverage gap
Stop-loss turns trend into a financing problem
In June 2026, Segal reported that medical stop-loss premiums had increased nearly 13 percent, driven by the high-cost claims that increasingly shape employer plan performance. The connection to the 2027 trend survey is straightforward: specialty drugs, biologics, and outpatient hospital claims are not only medical and pharmacy trend items. They are also part of the high-cost claim concentration that influences specific stop-loss exposure and renewal conversations.
Not every specialty claim will cross a specific deductible. But when high-cost claims are concentrated in expensive sites of care, employers can feel the impact in two places: the claim itself and the cost of transferring that risk. A sponsor that does not review the pathway for major infused claims is accepting both exposures without testing the alternatives.
Biosimilars show why active sourcing matters
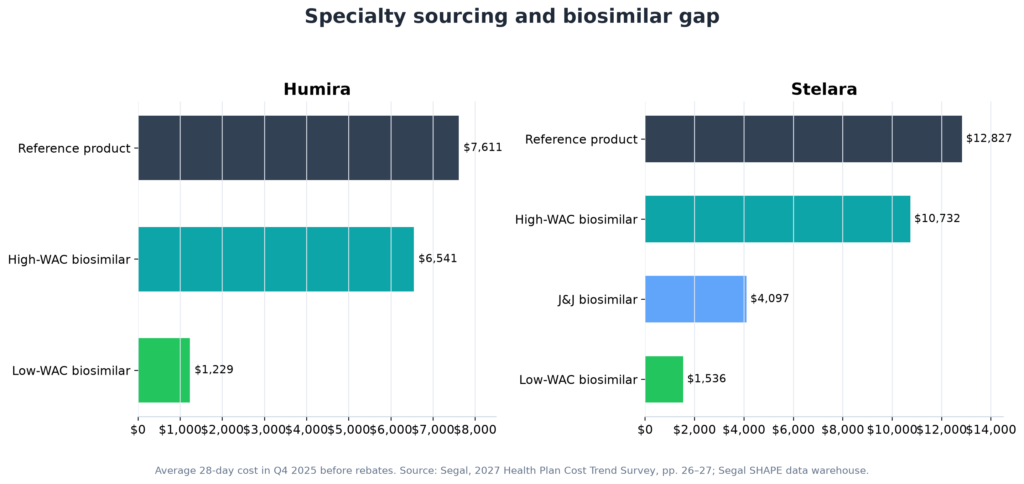
Segal’s SHAPE data illustrates the difference between having a lower-cost option available and actually using it. In the fourth quarter of 2025, Humira’s average 28-day cost was $7,611. High-WAC biosimilars averaged $6,541. Low-WAC biosimilars averaged $1,229, an 84 percent reduction.
For Stelara, the reference product averaged $12,827 per 28-day cycle. A low-WAC biosimilar averaged $1,536, roughly 88 percent below the reference product. The J&J biosimilar averaged $4,097.
Those comparisons do not guarantee the same result for every plan. They show why availability is not the same as adoption. A sponsor needs to evaluate formulary positioning, clinical appropriateness, provider behavior, benefit design, and actual net paid amounts. A passive default will not answer those questions.
Figure 3. Specialty sourcing and biosimilar gap
Rebates are one variable, not the strategy
Segal reports that the median rebate among survey respondents represented 30 percent of projected 2027 prescription drug allowed costs. That is a meaningful number, but it is not the same as lowest net cost.
Segal also reports that federal PBM reform enacted in 2026 is expected to reshape rebate economics. Under the report’s description of the Consolidated Appropriations Act of 2026, covered group health plans and issuers will receive 100 percent of manufacturer rebates, fees, and other remuneration, along with enhanced disclosure and audit rights, although many commercial-market requirements do not take effect until 2028 to 2029. Employers should prepare for that shift, but they should not wait for regulation to solve the cost problem.
A serious review must look beyond the rebate line. Employers should understand administrative fees, specialty pharmacy charges, clinical program fees, affiliate arrangements, spread, and any other compensation that affects the amount the plan ultimately pays. Transparency tells you where the problem is. You still need a solution that works across the entire claim pathway.
What employers should do before 2027
Segal found that plan sponsors using multiple cost-management strategies tend to experience lower trends than sponsors taking a hands-off approach. Site-of-care steerage entered the top five medical cost-management strategies. On the pharmacy side, the top strategies include addressing diabetes and anti-obesity GLP-1 medications, managing specialty drugs, and controlling specialty drug mix through biosimilar strategies.
The practical work should start now:
Pull the highest-cost medical and pharmacy claims and reconcile them into one view.
Identify the place of service and site of administration for infused and injected therapies.
Compare actual net paid amounts with clinically appropriate alternatives, including biosimilars and lower-cost sites of care.
Review 340B pricing, Manufacturer Assistance Programs (MAP), clinical interventions, foundation and Patient Assistance Advocacy, and clinical trial program access where appropriate.
Document why the chosen pathway was clinically appropriate and financially defensible.
This work does not require employers to replace their partner ecosystem. Brokers connect sponsors to expertise. TPAs administer claims. PBMs process pharmacy benefits. Segal provides independent trend and actuarial perspective. An employer-side managed services layer can help evaluate the net-cost pathway across those channels. NIH is not the plan fiduciary. The employer retains that responsibility. NIH’s role is to help plan sponsors evaluate and execute a multi-channel approach across high-cost claims.
Documentation is not a promise of better stop-loss terms. It is evidence that the sponsor is actively managing the risk and gives the employer something concrete to bring into renewal and stop-loss discussions.
Do not wait for renewal
Segal’s conclusion is the right one: employers need coordinated action across plan design and networks, vendor and PBM accountability, and population health, all supported by strong analytics. The 2027 strategy should not be built around one lever, one vendor, or one renewal meeting.
The math is not complicated. Outpatient hospital trend is above 10 percent. Prescription drug trend is also in double digits. Specialty claims are shaping stop-loss economics. The question is whether employers will review the claim pathway before 2027 or keep paying hospital prices because that is where the claim happened to land.
Do not wait for renewal to discover what your high-cost claims are doing to the plan. Pull the data, challenge the pathway, and build the record now.
Jake Velie is Chairman & CEO of National Integrative Health, a managed services organization headquartered in West Des Moines, Iowa, specializing in prescription drug cost optimization for employer health plans.
Sources and footnotes
1. Segal, 2027 Health Plan Cost Trend Survey, 30th annual edition (2026), especially pp. 4–5, 8–12, 19–27. All Segal projections and SHAPE figures in this draft were checked against the supplied PDF.
2. Insurance Business Magazine, “Employer health costs near 15-year high as billing pressures mount,” August 2026. Direct article URL was not included in the supplied materials and should be added before publication.
3. Segal, “Medical Stop-Loss Premiums Increase Nearly 13 Percent,” June 2026. Direct article URL was not included in the supplied materials and should be added before publication.
By Jake Velie, Chairman & CEO, National Integrative Health
The National Alliance of Healthcare Purchaser Coalitions just released its 2026 Pulse of the Purchaser survey, and if you run a self-funded health plan, you should read it carefully.¹
Not because it says anything surprising about costs. Costs are up. Everyone knows that. The average employer expects a 7.7% increase before plan design changes, and one in three projects 9% or more. That has been the background noise for years.
What makes this year’s data important is what it says about who actually does something about it, and why.
The answer is not what most people assume.
Cost Pressure Does Not Predict Action
Here is the finding that should stop every benefits leader in their tracks: employers facing the steepest cost increases are not significantly more likely to have purchasing strategies in place.¹
Read that again.
The employers getting hit hardest are not the ones doing the most. Employers paying above-average premiums are not doing more either. Neither cost level nor cost trajectory predicts whether an employer is actually managing spend.
So, what does?
Data access.
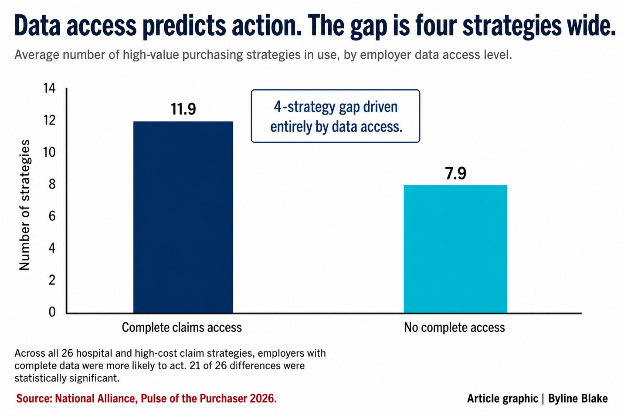
Employers with complete claim-level access to their medical data are running an average of 11.9 high-value purchasing strategies. Employers without that access are running 7.9.¹ That is a four-strategy gap driven entirely by whether the employer can see what is happening inside its own plan.
Across all 26 hospital and high-cost claim strategies measured in the survey, employers with complete claims data were more likely to be taking action. Every single one pointed the same direction. Twenty-one of the twenty-six differences were statistically significant.¹
This is not a minor methodological footnote. This is the central finding of the largest employer health purchasing survey in the country.
The Gap Is Not Intent. It Is Information.
Both groups of employers express similar levels of interest in managing costs. They are considering roughly the same number of strategies. The difference is that employers with data convert interest into action at dramatically higher rates.
As one respondent put it: “Even if I did have access to our data, I don’t know that I have the capacity to review and make decisions.”¹
That quote is important because it captures both sides of the problem. Access is necessary but not sufficient. Employers also need the operational support to translate claims intelligence into purchasingdecisions. But without access, the conversation never starts.
Roughly one in three employers in the survey report they do not have complete claim-level access to their medical data.¹ Only about three in five are confident they can audit their own complete files. And where the data is stored matters: three-quarters of employers keep claims with their health plan or TPA, and that group reports the lowest access rates. Employers using an independent data warehouse report access rates above 84%.¹
The practical implication is straightforward. If your claims data lives inside the same vendor relationship you are trying to evaluate, you are less likely to have unfettered access to it. And if you do not have access, you are less likely to act.
Where the Money Goes
For the first time, the survey asked employers to estimate how their healthcare dollars are allocated. The results confirm what many plan sponsors suspect but have not documented:
Hospital and facility costs account for 30.5% of total spend.¹ Prescription drugs take 21.1%. Professional fees account for 19.1%.
But here is the number worth dwelling on. The National Alliance estimates that when hospital-affiliated professional fees and physician-administered drugs billed through hospital systems are included, hospital services approach half of every dollar employers spend on healthcare.² That is not a fringe claim. That is the survey sponsor’s own analysis, and it aligns with what we see in high-cost claim reviews every week.
If hospitals are consuming close to half the spend, and only 30% of employers regularly use hospital price and quality information to guide purchasing decisions,¹ the gap between problem and response is enormous.
The most commonly reported barrier to using that information? Limited internal staff capacity.¹ Not lack of interest. Not disagreement with the approach. Capacity.
The PBM Market Is Moving, and the Data Explains Why
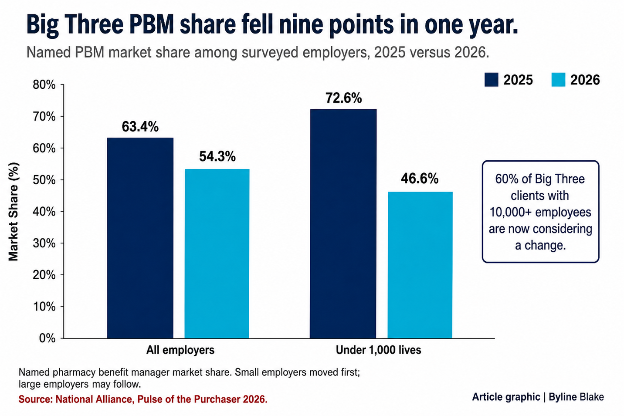
The survey documents a meaningful shift in PBM market share. Big Three PBM share of named pharmacy benefit managers fell from 63.4% in 2025 to 54.3% in 2026.¹ That is a nine-point decline in a single year.
The shift came almost entirely from employers under 1,000 lives, where Big Three share dropped 26 points.¹ Small employers moved first because they can move faster. But 60% of Big Three clients with 10,000 or more employees are now considering a change, suggesting the next wave could come from the largest purchasers.¹
What is driving it? Contract terms and fiduciary confidence.
On every contract protection measured except rebate pass-through, employers using non-Big Three PBMs report stronger terms: no spread pricing, disclosure of affiliated entities and compensation, and lowest-net-cost formulary design.¹ The gaps are consistent, ranging 16 to 18 percentage points.
Big Three clients are nearly three times as likely to question the integrity of PBM administration (36% versus 13%) and the reasonableness of PBM compensation (35% versus 12%).¹ And employers without full pharmacy claims access are more than twice as likely to express concern about both measures.
Opacity and distrust travel together. That is not speculation. That is what the data shows.
This matters in the context of new federal law. The Consolidated Appropriations Act of 2026 will require PBMs to pass through 100% of rebates and other remuneration beginning with plan years starting 30 months after February 3, 2026.³ For calendar-year plans, that generally means January 1, 2029. Employers should be evaluating their PBM contracts now against what that timeline will require.
Policy Engagement Is Rising Because Frustration Is Hardening Into Specific Asks
The survey documents something subtle but important: employer threat ratings are falling while support for regulation is rising.¹
Drug prices as a significant threat fell from 93% in 2024 to 77% in 2026. Hospital prices fell from 82% in 2023 to 68%.¹ But over the same period, support for PBM reform rose 20 points to 88%, and support for hospital rate regulation rose 17 points to 83%.¹
Those two trends moving in opposite directions tell you something. Employers are not less worried. They have moved past alarm and into specific policy demands. Frustration has hardened into targeted asks.
More than half of employers now engage in federal or state health policy, up nearly nine percentage points in a single year.¹ And once again, data access is the dividing line: employers with full pharmacy claims access are 22 percentage points more likely to participate in policy discussions.¹
The pattern is consistent. Data access predicts action. Data access predicts confidence. Data access predicts engagement. If you take one thing from this survey, it should be that the single most important investment a plan sponsor can make is ensuring unfettered access to its own claims data.
What This Means for Plan Sponsors
The survey identifies a clear hierarchy of what matters:
Get complete access to your claims data. Medical and pharmacy, separately. Not aggregate reports. Not vendor-curated dashboards. Claim-level data with audit rights you can actually exercise.
Store that data independently. Employers using independent data warehouses report access rates above 84%. Employers storing data with their health plan or TPA report rates near 59%.¹ Where the data lives determines whether you can use it.
Use the data to evaluate, not just to report. Small employers use claims data for cost analysis. Large employers use it for vendor accountability, financial integrity review, and benchmarking.¹ Theprogression from tracking to governing is where value creation happens.
Evaluate your PBM contract against the new federal standard. If your contract does not already include no spread pricing, full compensation disclosure, and lowest-net-cost formulary design, you are behind the market. The survey shows non-Big Three employers already have these protections at significantly higher rates.¹
Treat site-of-care strategy as a first-order purchasing decision. Hospital and facility spend is the largest single category. More than half of employers are already steering members to higher-value sites or using centers of excellence.¹ If you are not among them, you are absorbing costs that other employers are managing.
The Uncomfortable Truth
This survey confirms something that should make every plan sponsor uncomfortable: the system is designed to limit your visibility.
Vendors who administer your claims also control your data access. PBMs whose compensation you cannot verify also design your formulary. Hospitals whose prices you cannot compare also dictate where care is delivered.
The employers who break through that design limitation are the ones who insist on data access, exercise audit rights, evaluate contract terms, and treat purchasing as an active discipline rather than a passive administrative function.
The 2026 Pulse of the Purchaser makes the case clearly: what separates employers who act from those who do not is not what they pay. It is what they can see.
If you cannot see your data, you cannot manage your plan. And if you are relying on the same vendors whose performance you need to evaluate to give you the information you need to evaluate them, you have a structural conflict that no dashboard will solve.
The question for every plan sponsor reading this is simple: do you have complete, independent access to your own claims data, and are you using it to hold every vendor relationship to account?
If the answer is no, that is where to start.
Jake Velie is Chairman & CEO of National Integrative Health, a managed services organization headquartered in West Des Moines, Iowa, specializing in prescription drug cost optimization for self-funded employer health plans.
National Alliance of Healthcare Purchaser Coalitions. “Setting the Record Straight: A Challenge to Align Hospital Prices with Value.” 2026. The Alliance estimates that when hospital-affiliated professional fees and physician-administered drugs billed through hospital systems are included, hospital services approach half of every employer healthcare dollar.
Consolidated Appropriations Act, 2026, H.R. 7148, 119th Congress, enacted February 3, 2026. Requires PBMs to pass through 100% of rebates and other remuneration beginning with plan years starting 30 months after enactment (August 3, 2028). For calendar-year plans, this requirement would generally begin January 1, 2029.
HVBA Innovation Summit Tampa Brings Industry Leaders Together for Education, Connection and an Unforgettable Casino Night
The Health & Voluntary Benefits Association® (HVBA) brought together brokers, consultants, industry leaders, innovators and strategic partners in Tampa for the 2026 HVBA Innovation Summit, delivering two days filled with meaningful conversations, timely education, relationship-building and plenty of fun.
The experience began Wednesday evening with an exclusive VIP Dinner for HVBA Board Members and invited guests, creating an intimate setting for industry leaders to connect before the Summit officially began. The private event was held by invitation from HVBA Chairman & CEO Robert S. Shestack and gave attendees an opportunity to strengthen existing relationships, welcome new faces and begin conversations that continued throughout the following day.
That spirit of connection carried directly into Thursday’s Innovation Summit at Hotel Alba Tampa, where attendees heard from an impressive lineup of speakers addressing some of the most important issues affecting employers, brokers and the benefits industry today.
Mike Hirshberg, Division Sales Manager with MassMutual, welcomed attendees and moderated the afternoon’s educational programming.
Chris McLellan, PMP, Vice President of Operations at MedWatch, opened the educational content with “Transforming GLP-1 Coverage Through a Sustainable Carve-Out Model: A MedWatch Employee Population Case Study,” bringing a real-world perspective to one of the most pressing cost and coverage issues facing employer-sponsored health plans.
Cambria Smith, CEO of Aevitas, and Rick Solofsky, President and published author with Solofsky Financial Group, LLC, tackled “The Retirement-Medicare Crossroads: Helping Employers and Employees Navigate What Comes Next.” Their conversation focused on the growing challenges employers face as more employees work beyond age 65, including Medicare eligibility, compliance, workforce transitions and the need for stronger employee education.
David Sherman, Director of Channel and Partnerships at PTO Exchange, showed attendees how employers can rethink a benefit they already fund by transforming unused paid time off into greater financial flexibility for employees. His session demonstrated how innovation does not always require adding another benefit—it can also mean finding more value in the benefits already available.
Lee Stokes, CEO of Fidelity Enrollment Services, addressed “The Use of AI During the Enrollment Process for a Multi-generational Workforce,” exploring how technology and artificial intelligence can help improve communication and enrollment experiences across generations.
The afternoon continued with Jon O’Toole, Chief Revenue Officer of Recuro Health, sharing “Recuro Health Built Intentionally to Serve — A Success Story,” highlighting the importance of intentionally designing healthcare solutions around service, partnerships and measurable value.
One of the day’s most spirited conversations came during “What the Health?? Rx Costs Shouldn’t Be Hell,” featuring Jake Velie, Vice Chair & President of HVBA and Chairman & CEO of National Integrative Health; Rachel Strauss, Founder & CEO of PBM Princess; and Chris McLellan of MedWatch. The discussion brought together different perspectives on the rising cost and complexity of prescription drugs and challenged attendees to continue asking harder questions about how healthcare dollars are being spent.
Bill Viszt, Consultant with Smart Scan, also introduced attendees to “Smart Scan: Prevent Heart Attacks and Detect Cancer Before It Spreads,” highlighting another example of innovation focused on earlier identification and better health outcomes.
But the HVBA Innovation Summit was never intended to be an event where attendees simply listened to presentations and went home.
At 4:00 p.m., the educational sessions transitioned immediately into an upscale Casino Night Networking Reception, complete with a premium open bar, heavy butlered hors d’oeuvres, casino gaming, giveaways and raffle prizes.
The ballroom came alive as attendees moved from table to table, played casino games, laughed, competed and—most importantly—continued the conversations that had started during the Summit. The casino format was intentionally designed to keep people circulating throughout the room, helping brokers, solution providers and industry professionals connect with people they might not otherwise have had the opportunity to meet.
For HVBA, that is what makes the Innovation Summit experience different.
The goal is not simply to collect business cards. It is to create an environment where meaningful introductions can become partnerships, partnerships can become business, and new ideas can ultimately help brokers and employers better serve the people depending on their benefit programs.
“The energy in Tampa was incredible,” said Robert S. Shestack, Chairman & CEO of HVBA. “From our private VIP Dinner Wednesday night to the educational sessions and then Casino Night, people were talking, laughing, learning and doing business. That is exactly what we want an HVBA event to accomplish. We want people to leave with new ideas, new relationships and real opportunities—not simply another stack of business cards.”
The Tampa Innovation Summit continued HVBA’s longstanding mission of bringing together leaders from across the health and voluntary benefits industry to exchange practical insights, discover emerging solutions and build relationships capable of moving the industry forward.
And if the laughter, conversations and packed casino tables were any indication, Tampa delivered.
About the Health & Voluntary Benefits Association®
The Health & Voluntary Benefits Association® (HVBA) is an industry organization focused on education, innovation, networking and professional development throughout the health and voluntary benefits marketplace. Since 2008, HVBA events have helped brokers, consultants, carriers, TPAs, solution providers and HR professionals better understand the evolving benefits landscape while connecting with organizations and leaders capable of helping their businesses grow.
HVBA Innovation Summit Returns to Tampa August 20 with Cutting-Edge Healthcare Sessions and Upscale Casino-Themed Networking Reception
TAMPA, FL — August 19, 2026 — The Health & Voluntary Benefits Association® (HVBA) will bring benefits professionals, brokers, consultants, healthcare innovators and industry leaders together at the 2026 HVBA Innovation Summit – Tampa on Thursday, August 20, 2026, at Hotel Alba Tampa.
Designed to be more than a traditional industry conference, the HVBA Innovation Summit combines timely education with intentional networking opportunities created to help attendees discover new solutions, develop meaningful partnerships and leave with opportunities to grow their businesses.
The Innovation Summit will take place from 1:00 PM to 4:00 PM ET and will be moderated by Mike Hirshberg, Division Sales Manager, MassMutual.
“This event is about bringing the right people into the room and creating conversations that can lead to real business,” said Robert Shestack, Chairman & CEO of HVBA. “Our Innovation Summits give brokers and industry professionals an opportunity to hear what is changing in healthcare and benefits while connecting directly with organizations developing solutions to some of employers’ biggest challenges.”
The Tampa program will feature a series of concise, thought-provoking sessions focused on issues impacting employers, employees, brokers and benefit advisors.
Topics include:
Transforming GLP-1 Coverage Through a Sustainable Carve-Out Model: A MedWatch Employee Population Case Study Presented by Chris McLellan, PMP, Vice President, Operations, MedWatch, the session will explore an alternative approach to managing the growing financial impact of GLP-1 medications.
The Retirement-Medicare Crossroads: Helping Employers and Employees Navigate What Comes Next Cambria Smith, CEO of Aevitas, and Rick Solofsky, President and Published Author, Solofsky Financial Group, LLC, will discuss the increasingly important intersection between retirement planning, Medicare and employer benefits.
How PTO Exchange Turns Unused Time into Financial Flexibility David Sherman, Director of Channel and Partnerships, PTO Exchange, will examine how unused paid time off can be transformed into meaningful financial benefits for employees.
The Use of AI During the Enrollment Process for a Multi-Generational Workforce Lee Stokes, CEO, Fidelity Enrollment Services, will discuss how artificial intelligence is changing benefits enrollment and helping employers communicate with an increasingly diverse, multi-generational workforce.
VCRx Update Robert Shestack, Chairman & CEO, HVBA, will provide an industry update on VCRx.
Recuro Health Built Intentionally to Serve – A Success Story Jon O’Toole, Chief Revenue Officer, Recuro Health, will share insights into Recuro Health’s growth, strategy and approach to serving clients in today’s evolving healthcare environment.
The educational program culminates with the provocative fireside discussion:
“What the Health?? Rx Costs Shouldn’t Be Hell”
The conversation will feature Jake Velie, Vice Chair & President, HVBA and Chairman & CEO, National Integrative Health; Rachel Strauss, Founder & CEO, Rachel Strauss PBM Princess; and Chris McLellan, PMP, Vice President, Operations, MedWatch.
The panel will examine the rising cost and complexity of prescription drugs, PBM strategy, high-cost pharmacy and other areas where brokers and employers can challenge traditional approaches and identify new opportunities for savings.
From Education to an Upscale Casino Night Experience
Immediately following the Innovation Summit, attendees will transition into an upscale Casino-Themed Networking Reception from 4:00 PM to 7:00 PM ET in the Westshore Ballroom.
The reception will feature a premium open bar, heavy butler-passed hors d’oeuvres, casino gaming, networking and premium giveaways, creating a lively environment designed specifically to encourage attendees to move around the room, meet new people and develop meaningful business relationships.
Casino games begin at 4:00 PM, followed by heavy passed hors d’oeuvres beginning at 4:30 PM. Attendees will have opportunities throughout the evening to earn entries for premium giveaways, with winning tickets pulled between 6:30 PM and 7:00 PM. Attendees must be present to win.
Rather than relying on traditional exhibit booths, HVBA events are designed around interaction and relationship-building — giving solution providers, brokers and industry leaders more opportunities to have substantive conversations.
More Than Business Cards
The philosophy behind HVBA’s Innovation Summits is simple: attendees should leave with more than a stack of business cards.
Through focused education, curated introductions and experiential networking, HVBA creates an environment where brokers can discover solutions to help retain and gain clients, while healthcare and benefits companies can develop partnerships with professionals actively looking for innovation.
The Tampa event also includes the HVBA Board Meeting on Thursday morning, open to board members and invited guests, as well as a private, invitation-only dinner on Wednesday, August 19, sponsored by Juice Financial.
The private dinner will bring invited guests together for an intimate evening of introductions, conversation and relationship-building before the Summit officially begins.
The 2026 HVBA Innovation Summit – Tampa will be held Thursday, August 20, at Hotel Alba Tampa.
Attendance is limited, and qualified brokers may attend the Innovation Summit at no cost.
For registration information and additional details, visit the Health & Voluntary Benefits Association® website.
About the Health & Voluntary Benefits Association®
The Health & Voluntary Benefits Association® (HVBA) brings together brokers, consultants, employers, carriers, solution providers and benefits innovators to advance meaningful conversations and partnerships throughout the healthcare and employee benefits ecosystem. Through Innovation Summits, industry education, research, media and curated networking opportunities, HVBA works to connect professionals with the ideas, technologies and relationships that can help improve benefits strategies and business outcomes.
By Jake Velie, Chairman & CEO, National Integrative Health
The New England Journal of Medicine just published an article calling self-insured employers “A Sleeping Giant of Health Care Affordability.”¹ The authors, Dr. Suhas Gondi and Dr. Zirui Song, wrote it because most physicians do not know that a self-insured employer sits behind that carrier card their patient walks in with.
That is not a minor knowledge gap. That is the root cause of a dysfunction that costs plans millions and leaves patients stuck in the middle.
Stacey Richter makes the point directly in the title of her Relentless Health Value episode on this article: “The Sleeping Giants of Healthcare. Why Self-Insured Employers and Clinicians Keep Missing Each Other.”² There are two sleeping giants here, not one. Employers and clinicians both hold enormous latent power over healthcare costs and outcomes. Neither has historically used it well. And the reason is simple. They do not talk to each other.
The GLP-1 Case Study That Should Make Employers Uncomfortable
Dr. Gondi laid out a scenario on the Relentless Health Value podcast that every self-funded plan sponsor should hear.²
A physician and patient decide together that a GLP-1 is clinically appropriate. The patient confirms coverage with their employer. The physician writes the script, completes the prior authorization, sends it to the pharmacy. Everything is done correctly.
Then the claim is denied at the counter. Out-of-pocket cost: list price. Patient walks away without the medication.
What happened? The employer made a reasonable decision to cover GLP-1s only through a third-party vendor that wraps in health coaching, lifestyle management, and clinical oversight. That vendor is the sole covered prescriber under the plan. The employer did this because GLP-1 spend was increasing plan pharmacy costs by double digits and adherence without wraparound support is dismal.
But nobody told the prescribing physician. There is no feedback loop from the pharmacy back to the clinic. The doctor does not find out until the three-month follow-up. The patient is frustrated. The physician is frustrated. The employer thinks it did the right thing and never gets credit for it.
That is not a technology failure. That is a coordination failure. And it is exactly the kind of failure that keeps compounding across the system when the two parties with the most at stake never communicate directly.
Site of Care Is Not a Coverage Denial. It Is a Routing Problem.
Dr. Gondi’s second example is one I see constantly in our work at NIH, and it illustrates the problem even more starkly.
A member is diagnosed with cancer. The oncologist at a large academic health system prescribes first-line therapy. The prior authorization is denied. Both the physician and the patient are stunned.
The employer did not deny the drug. The employer denied the site of administration. The same medication administered at the hospital-owned infusion center costs 40 percent more than it would at a physician office or home infusion setting.³ The employer implemented a site-of-care program. The oncologist had no idea.
This is where good intentions collide with poor execution. The employer’s goal is legitimate. Site-of-care economics are real and well documented.³ But a denial without navigation is not a site-of-care strategy. It is a coverage barrier wearing a cost-containment label.
The difference between a plan that steers effectively and one that just generates friction is whether someone is doing the work of connecting the physician, the patient, and the employer-side strategy before the denial hits. That means provider communication, member navigation, and clinical coordination. Without those, site-of-care programs create exactly the dysfunction Dr. Gondi describes.
Why This Gap Persists
Dr. Gondi makes a critical observation: electronic medical records are billing instruments designed to optimize revenue for health systems.² They are not designed to help clinicians understand plan economics, site-of-care alternatives, or employer coverage strategies.
As Richter puts it in the episode, Epic is not going to program a prompt that tells a clinician to find out whether the right site of care might be somewhere else. That would be programming network leakage, her term for what hospital systems call it when a patient leaves their network for care elsewhere, into a system whose primary customer is the hospital.²
So, the information gap persists by design. The employer makes a smart cost-containment decision. The physician never hears about it. The patient bears the friction. And everybody involved thinks the other party is the problem.
This is why the gap between employer strategy and clinical reality matters so much. If no one is translating coverage decisions into provider-facing communication, the system defaults to denial and confusion. The patient gets caught in the middle, and both giants remain frustrated with each other instead of working together.
What Plan Sponsors Should Learn From This
The pattern in both of Dr. Gondi’s examples is the same. The employer made a defensible decision. The clinician was never informed. The patient absorbed the fallout.
That pattern will keep repeating until plan sponsors treat provider communication as a core part of benefit design, not an afterthought. Every coverage change that alters how a clinician’s order gets fulfilled should include a communication plan for the prescribing community. That is not optional. It is the difference between cost containment and cost confusion.
It also means that whatever partners an employer relies on, whether a PBM, TPA, consultant, or managed services organization, those partners need to be evaluated on whether they are actually closing the loop between employer intent and clinical reality. If your vendor’s version of site-of-care optimization is a prior authorization denial with no navigation, no provider outreach, and no member support, that is not optimization. That is a barrier dressed up as a strategy.
The Real Takeaway for Plan Sponsors
Dr. Gondi’s advice is sound: employers with local presences should engage directly with local providers when making significant coverage changes.² Do not assume the information will travel through the PBM or TPA to the prescriber. It will not.
But communication alone is not enough. You need an operational discipline that treats provider awareness as part of plan design. When you implement a new coverage pathway, build the prescriber communication into the implementation timeline. When you add a vendor, make sure the vendor’s workflow includes closing the loop with the treating physician. When you steer site of care, make sure a navigator is doing the work before the denial letter lands in a patient’s mailbox.
If your plan has implemented site-of-care steering, GLP-1 vendor requirements, biosimilar step therapy, or any other cost-containment measure that changes how a clinician’s order gets fulfilled, ask yourself one question: does my physician network actually know about it before the denial hits?
If the answer is no, you do not have a cost-containment strategy. You have a friction generator. And your members are the ones paying for it.
The two sleeping giants do not need to keep missing each other. But somebody has to build the bridge. That is the work.
Jake Velie is Chairman & CEO of National Integrative Health, a managed services organization headquartered in West Des Moines, Iowa, specializing in prescription drug cost optimization for employer health plans.
Footnotes
¹ Gondi, Suhas and Song, Zirui. “A Sleeping Giant of Health Care Affordability—Self-Insured Employers.” New England Journal of Medicine, 2026. https://www.nejm.org/doi/full/10.1056/NEJMp2517872
² Richter, Stacey. “Episode 523: The Sleeping Giants of Healthcare. Why Self-Insured Employers and Clinicians Keep Missing Each Other.” Relentless Health Value, 2026. Interview with Dr. Suhas Gondi. https://relentlesshealthvalue.com/blog/transcript-for-ep523-with-suhas-gondi
³ Magellan Rx Management. “Medical Pharmacy Trend Report: Site of Care Optimization.” Research shows that shifting infusion administration from hospital outpatient departments to physician offices, home infusion, or ambulatory infusion centers can reduce per-administration costs by 40–60%.
PBMs Keep Putting It in Writing: They Are Not the Fiduciary
By Jake Velie, Chairman & CEO, National Integrative Health
The most important sentence in some PBM paperwork is not buried in the pricing exhibit. It is not in the rebate schedule. It is not in the reporting package.
It is the disclaimer.
In one PBM pharmacy service agreement reviewed by our team, the language is direct: in providing services under the agreement, the PBM “is not acting as a fiduciary” under ERISA, and the client “shall not name” the PBM “as a plan fiduciary.”¹ That is not unusual. It is honest contract drafting. But it should get every self-funded employer’s attention.
Why? Because the plan sponsor still holds the liability, even while the PBM controls a huge amount of the machinery.
PBMs adjudicate claims. They build networks. They negotiate rebates. They issue reports. They manage specialty channels. They influence formularies and utilization patterns. But when it comes to fiduciary responsibility, many of them are telling employers exactly where they stand: not here.
What one PBM does well
To be clear, this is not a hit piece on any single company. The agreement and reporting package we reviewed show a PBM doing a number of operational things employers need done.
The contract lays out claims processing, network administration, customer service, implementation support, audits, reporting, specialty pharmacy services, and rebate administration.² The fee schedule is straightforward enough to tell the client what it will pay for paid claims, prior authorizations, reporting requests, and other administrative functions.³ The agreement also states that the manufacturer’s rebate share to the client is 100%.³
The reporting itself is also the kind of visibility many employers say they want. The 2025 and Q1 2026 client summary reports show plan spend, member spend, rebates, net plan spend, generic utilization, specialty concentration, and other utilization markers.⁴ That is useful information. Employers need reporting. They need operational execution. They need a PBM that can keep the benefit running.
But here is the mistake too many plan sponsors still make: they confuse administration with alignment.
A clean report is not a fiduciary strategy. A rebate line is not a fiduciary strategy. A contract that spells out responsibilities is not the same as a partner taking fiduciary responsibility off your plate.
It does not.
The sentence employers cannot ignore
ERISA does not let a plan sponsor shrug and point downstream. The fiduciary standard follows the employer’s role in managing plan assets and plan decisions.⁵ If your PBM agreement says the PBM is not the fiduciary, believe it.
That means the employer still owns the hard questions:
Are we paying the lowest net cost available for this drug?
Are rebate economics distorting our decision-making?
Are we overusing high-cost sites of administration?
Are there lower-cost biosimilar or therapeutic alternatives?
Are we using Manufacturer Assistance Programs (MAP), foundation support, and patient assistance opportunities where appropriate?
Do we have a documented process showing we evaluated those alternatives?
That last point matters more every year. The Consolidated Appropriations Act forced more disclosure into the pharmacy benefit system, but disclosure alone does not satisfy fiduciary duty.⁶ Transparency tells you where the problem is. You still need a solution.
Reporting does not equal optimization
The summary reports make the point for me.
In the 2025 report reviewed by NIH, specialty plan spend accounted for 71.6% of total plan spend.⁴ In Q1 2026, that figure rose to 88.1%.⁴ Those are not abstract numbers. That is concentration risk. That is exactly why employers cannot afford to look at pharmacy through a single-channel PBM lens.
Even with rebates reflected in the reporting, the employer still needs an independent strategy for where each claim should go and which levers should be pulled. If specialty utilization is dominating spend, the employer cannot be satisfied with getting a quarterly report and hoping the economics work themselves out.
At NIH, we take the opposite view. We assume every high-cost claim deserves to be challenged.
Where NIH changes the equation
National Integrative Health is not trying to become the PBM. We are the managed services layer that sits on the employer’s side of the table.
It is also important to be clear about what we are not. NIH is not the plan fiduciary. The employer still holds that responsibility. Our role is to help plan sponsors meet it with better oversight, better documentation, and better net-cost execution.
That matters because our job is not to protect a single channel. Our job is to drive the lowest net cost across all available channels.
That means looking at 340B pricing, biosimilar pathways, site of administration optimization, Manufacturer Assistance Programs (MAP), clinical interventions, foundation and patient assistance advocacy, and clinical trial access.⁷ ⁸ We are not dependent on a single regulatory outcome or a single vendor revenue model. We are focused on the employer’s result.
So, when a PBM contract says, in effect, “we administer the program but we are not the fiduciary,” our response is simple: then the employer needs someone on its side who is actually waking up every day thinking like an owner.
That is where NIH fits.
This is a partner model, not a replacement fantasy
Employers do not need to blow up their ecosystem to fix this problem.
Brokers still matter. TPAs still matter. PBMs still matter. Auditors and consultants still matter.
But each of those partners has a different role.
Brokers connect plan sponsors to expertise. TPAs handle claims administration. PBMs process the pharmacy benefit and related operations. Auditors test the math and the compliance record. NIH helps the employer prove it asked the right questions, evaluated the right alternatives, and pursued the lowest net cost available.
That is the gap I see again and again in this market. Plenty of reporting. Plenty of vendors. Plenty of activity. Not enough employer-side orchestration.
Do not wait for the contract to save you
If your PBM has already told you in writing that it is not the fiduciary, take that statement seriously.
Do not wait for another lawsuit, another regulatory bulletin, or another renewal cycle to start building your fiduciary record. Start now. Review the contract language. Review the reporting. Review where specialty dollars are going. Then put a managed services strategy in place that proves you pursued the lowest net cost, not just the most convenient status quo.
The employers who get ahead of this will not be the ones with the prettiest PBM dashboard. They will be the ones who can show they understood the risk, challenged the model, and acted.
That is the standard now. And it should be.
Jake Velie is Chairman & CEO of National Integrative Health, a managed services organization headquartered in West Des Moines, Iowa, specializing in prescription drug cost optimization for employer health plans.
Footnotes
PBM pharmacy service agreement reviewed by NIH, effective April 1, 2017, Article VI, Section 6.2. Source material on file.
PBM pharmacy service agreement reviewed by NIH, effective April 1, 2017, Exhibit A, Scope of Services. Source material on file.
PBM pharmacy service agreement reviewed by NIH, effective April 1, 2017, Exhibit B, Administrative Fee Schedule, including claims processing fee and manufacturer rebate share to client. Source material on file.
2025 and Q1 2026 client summary reports reviewed by NIH. Source material on file.
Employee Retirement Income Security Act of 1974, 29 U.S.C. § 1002(21)(A), defining fiduciary functions under ERISA.
Consolidated Appropriations Act, 2021, Pub. L. No. 116-260, Division BB, Title II, establishing prescription drug cost reporting and related transparency obligations for group health plans and issuers.
National Integrative Health, “About Us,” describing NIH’s managed services model for prescription drug cost optimization. https://nationalintegrativehealth.com/
Magellan Rx Management, “Medical Pharmacy Trend Report: Site of Care Optimization,” describing savings potential from shifting infusion administration to lower-cost settings.