

The 2027 Cost Challenge Employers Can Act On: Site of Care, Stop-Loss, and Specialty Drug Sourcing

By Jake Velie, Chairman & CEO, National Integrative Health
The 2027 Segal Health Plan Cost Trend Survey should change the conversation for every self-funded employer. The issue is not simply whether costs will rise. It is whether the same high-cost claim will become more expensive because of its site of care, its sourcing pathway, and its lack of active management, then show up again in the plan’s stop-loss economics.
Segal projects 2027 medical trend for open-access PPO/POS plans at 9.9 percent. Outpatient prescription drug trend is projected at 11.5 percent before PBM rebates. Specialty drugs and biologics are projected at 11.9 percent. Those are near double-digit projections and the highest medical projections Segal has reported in nearly 15 years.
Insurance Business Magazine’s August coverage places the same pressure in the context of employer health costs and billing practices. That is useful context, but it is not an action plan. Employers need to know where the pressure is entering the claim and what they can do before the cost becomes a renewal problem.
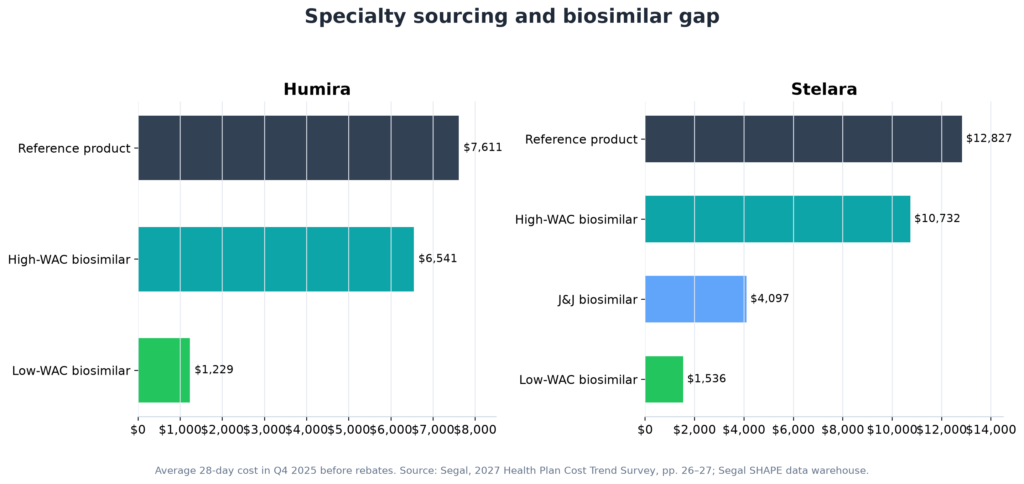
Figure 1. 2027 trend snapshot
The place of service is part of the claim
Segal’s SHAPE data warehouse, which tracks actual claims experience for a sample of large self-funded plan sponsors, found that medical trend reached 8.9 percent in 2025, up from 8.0 percent in 2024. Outpatient hospital expenses led the major service categories at 10.4 percent, compared with 5.8 percent for inpatient care and 8.2 percent for professional services.
That matters because many specialty biologics and infused therapies are administered through the medical benefit, often in outpatient hospital settings. Segal defines specialty drugs as generally high-cost therapies for rare conditions or drugs that require special handling, including products given by injection or infusion.
The clinical need may be the same, but the total cost can change materially based on where the therapy is administered, how the provider is reimbursed, and which sourcing channel is used. Segal reports hospital price inflation at 6.7 percent, compared with 2.4 percent hospital utilization. For physicians, the components are 3.5 percent price inflation and 4.0 percent utilization. The report defines hospitals here as inpatient and outpatient hospital services combined.
The point is not that every infusion belongs outside a hospital. The point is that every high-cost case deserves review. A clinically appropriate shift to an ambulatory infusion center, physician office, or home setting can materially change the cost of administration. Magellan Rx Management has cited research indicating that moving clinically appropriate infusions to lower-cost settings can reduce administration costs by 40 percent to 60 percent.
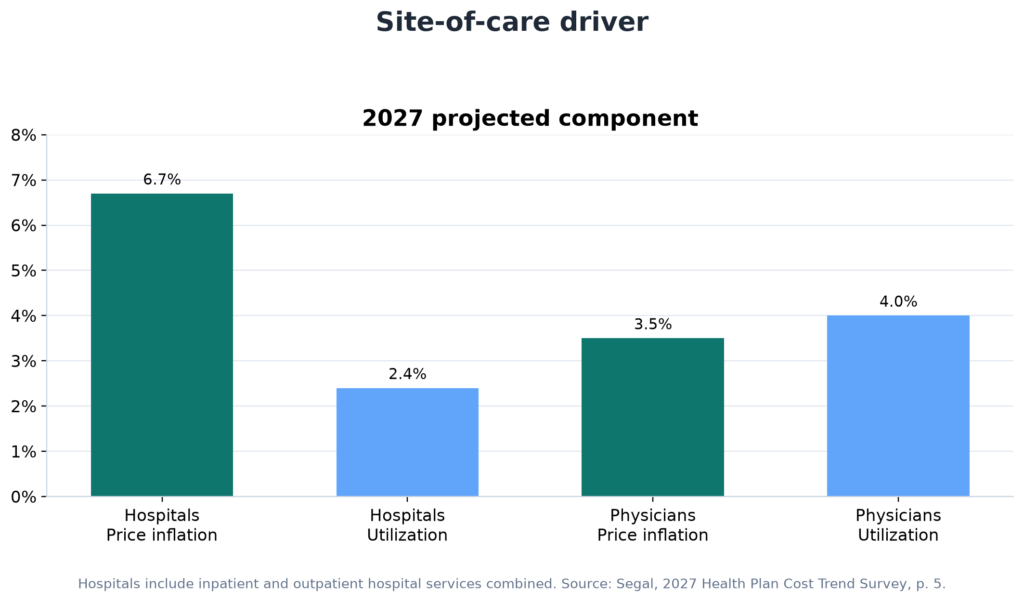
Figure 2. Site-of-care driver
Prescription drug trend is a mix and utilization problem
The 11.5 percent outpatient prescription drug projection should not be read as simple price inflation on existing products. Segal’s data points to a changing mix of therapies. Actual prescription drug trend increased from 10.4 percent in 2024 to 12.4 percent in 2025. New-to-market drugs launched within the previous five years accounted for 7.0 percentage points of that 12.4 percent, or almost 60 percent of actual 2025 trend.
That innovation is concentrated in oncology, immunology, rare disease, and cell and gene therapy, where costs are high and use is expanding. The practical question for employers is not whether innovation is valuable. It is whether the plan has a deliberate way to manage the mix, the channel, and the net cost as new therapies enter the benefit.
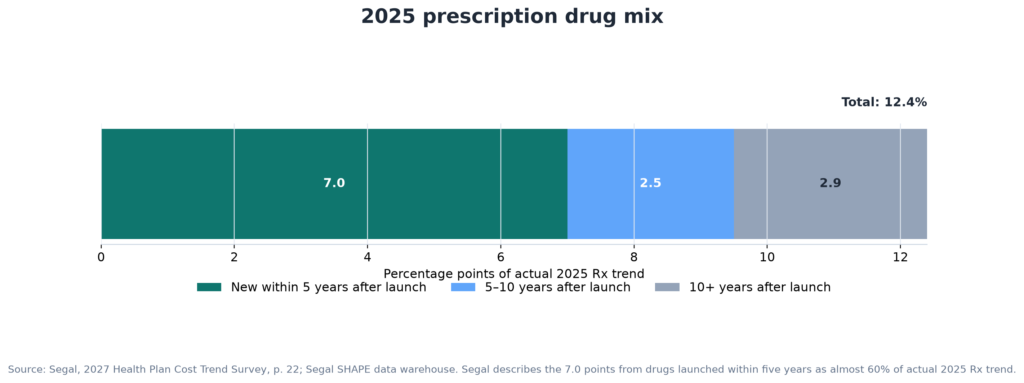
Figure 5. 2025 prescription drug mix
GLP-1s add another layer. Plans covering GLP-1s for obesity management experienced an 18.3 percent prescription drug trend in 2025, compared with 10.5 percent for plans that did not cover anti-obesity medications. Segal attributes 7.8 percentage points of the covered-plan trend to GLP-1s. This does not argue against coverage. It argues against treating coverage as the entire strategy. Employers need evidence-based criteria, clinical management, benefit design, and a clear access pathway for members and providers.
Figure 4. GLP-1 coverage gap
Stop-loss turns trend into a financing problem
In June 2026, Segal reported that medical stop-loss premiums had increased nearly 13 percent, driven by the high-cost claims that increasingly shape employer plan performance. The connection to the 2027 trend survey is straightforward: specialty drugs, biologics, and outpatient hospital claims are not only medical and pharmacy trend items. They are also part of the high-cost claim concentration that influences specific stop-loss exposure and renewal conversations.
Not every specialty claim will cross a specific deductible. But when high-cost claims are concentrated in expensive sites of care, employers can feel the impact in two places: the claim itself and the cost of transferring that risk. A sponsor that does not review the pathway for major infused claims is accepting both exposures without testing the alternatives.
Biosimilars show why active sourcing matters
Segal’s SHAPE data illustrates the difference between having a lower-cost option available and actually using it. In the fourth quarter of 2025, Humira’s average 28-day cost was $7,611. High-WAC biosimilars averaged $6,541. Low-WAC biosimilars averaged $1,229, an 84 percent reduction.
For Stelara, the reference product averaged $12,827 per 28-day cycle. A low-WAC biosimilar averaged $1,536, roughly 88 percent below the reference product. The J&J biosimilar averaged $4,097.
Those comparisons do not guarantee the same result for every plan. They show why availability is not the same as adoption. A sponsor needs to evaluate formulary positioning, clinical appropriateness, provider behavior, benefit design, and actual net paid amounts. A passive default will not answer those questions.
Figure 3. Specialty sourcing and biosimilar gap
Rebates are one variable, not the strategy
Segal reports that the median rebate among survey respondents represented 30 percent of projected 2027 prescription drug allowed costs. That is a meaningful number, but it is not the same as lowest net cost.
Segal also reports that federal PBM reform enacted in 2026 is expected to reshape rebate economics. Under the report’s description of the Consolidated Appropriations Act of 2026, covered group health plans and issuers will receive 100 percent of manufacturer rebates, fees, and other remuneration, along with enhanced disclosure and audit rights, although many commercial-market requirements do not take effect until 2028 to 2029. Employers should prepare for that shift, but they should not wait for regulation to solve the cost problem.
A serious review must look beyond the rebate line. Employers should understand administrative fees, specialty pharmacy charges, clinical program fees, affiliate arrangements, spread, and any other compensation that affects the amount the plan ultimately pays. Transparency tells you where the problem is. You still need a solution that works across the entire claim pathway.
What employers should do before 2027
Segal found that plan sponsors using multiple cost-management strategies tend to experience lower trends than sponsors taking a hands-off approach. Site-of-care steerage entered the top five medical cost-management strategies. On the pharmacy side, the top strategies include addressing diabetes and anti-obesity GLP-1 medications, managing specialty drugs, and controlling specialty drug mix through biosimilar strategies.
The practical work should start now:
- Pull the highest-cost medical and pharmacy claims and reconcile them into one view.
- Identify the place of service and site of administration for infused and injected therapies.
- Compare actual net paid amounts with clinically appropriate alternatives, including biosimilars and lower-cost sites of care.
- Review 340B pricing, Manufacturer Assistance Programs (MAP), clinical interventions, foundation and Patient Assistance Advocacy, and clinical trial program access where appropriate.
- Document why the chosen pathway was clinically appropriate and financially defensible.
This work does not require employers to replace their partner ecosystem. Brokers connect sponsors to expertise. TPAs administer claims. PBMs process pharmacy benefits. Segal provides independent trend and actuarial perspective. An employer-side managed services layer can help evaluate the net-cost pathway across those channels. NIH is not the plan fiduciary. The employer retains that responsibility. NIH’s role is to help plan sponsors evaluate and execute a multi-channel approach across high-cost claims.
Documentation is not a promise of better stop-loss terms. It is evidence that the sponsor is actively managing the risk and gives the employer something concrete to bring into renewal and stop-loss discussions.
Do not wait for renewal
Segal’s conclusion is the right one: employers need coordinated action across plan design and networks, vendor and PBM accountability, and population health, all supported by strong analytics. The 2027 strategy should not be built around one lever, one vendor, or one renewal meeting.
The math is not complicated. Outpatient hospital trend is above 10 percent. Prescription drug trend is also in double digits. Specialty claims are shaping stop-loss economics. The question is whether employers will review the claim pathway before 2027 or keep paying hospital prices because that is where the claim happened to land.
Do not wait for renewal to discover what your high-cost claims are doing to the plan. Pull the data, challenge the pathway, and build the record now.
Jake Velie is Chairman & CEO of National Integrative Health, a managed services organization headquartered in West Des Moines, Iowa, specializing in prescription drug cost optimization for employer health plans.
Sources and footnotes
- 1. Segal, 2027 Health Plan Cost Trend Survey, 30th annual edition (2026), especially pp. 4–5, 8–12, 19–27. All Segal projections and SHAPE figures in this draft were checked against the supplied PDF.
- 2. Insurance Business Magazine, “Employer health costs near 15-year high as billing pressures mount,” August 2026. Direct article URL was not included in the supplied materials and should be added before publication.
- 3. Segal, “Medical Stop-Loss Premiums Increase Nearly 13 Percent,” June 2026. Direct article URL was not included in the supplied materials and should be added before publication.
- 4. Magellan Rx Management, Medical Pharmacy Trend Report: Site of Care Optimization, as cited in NIH’s prior source notes, for the 40 percent to 60 percent administration-cost reduction range.
- 5. National Integrative Health, About Us, for the NIH managed-services description.
- 6. NIH fiduciary clarification draft, internal source stating that NIH is not the plan fiduciary and that the employer retains that responsibility.